The Changing NFL & New All Time QB Analysis: Who's the best?
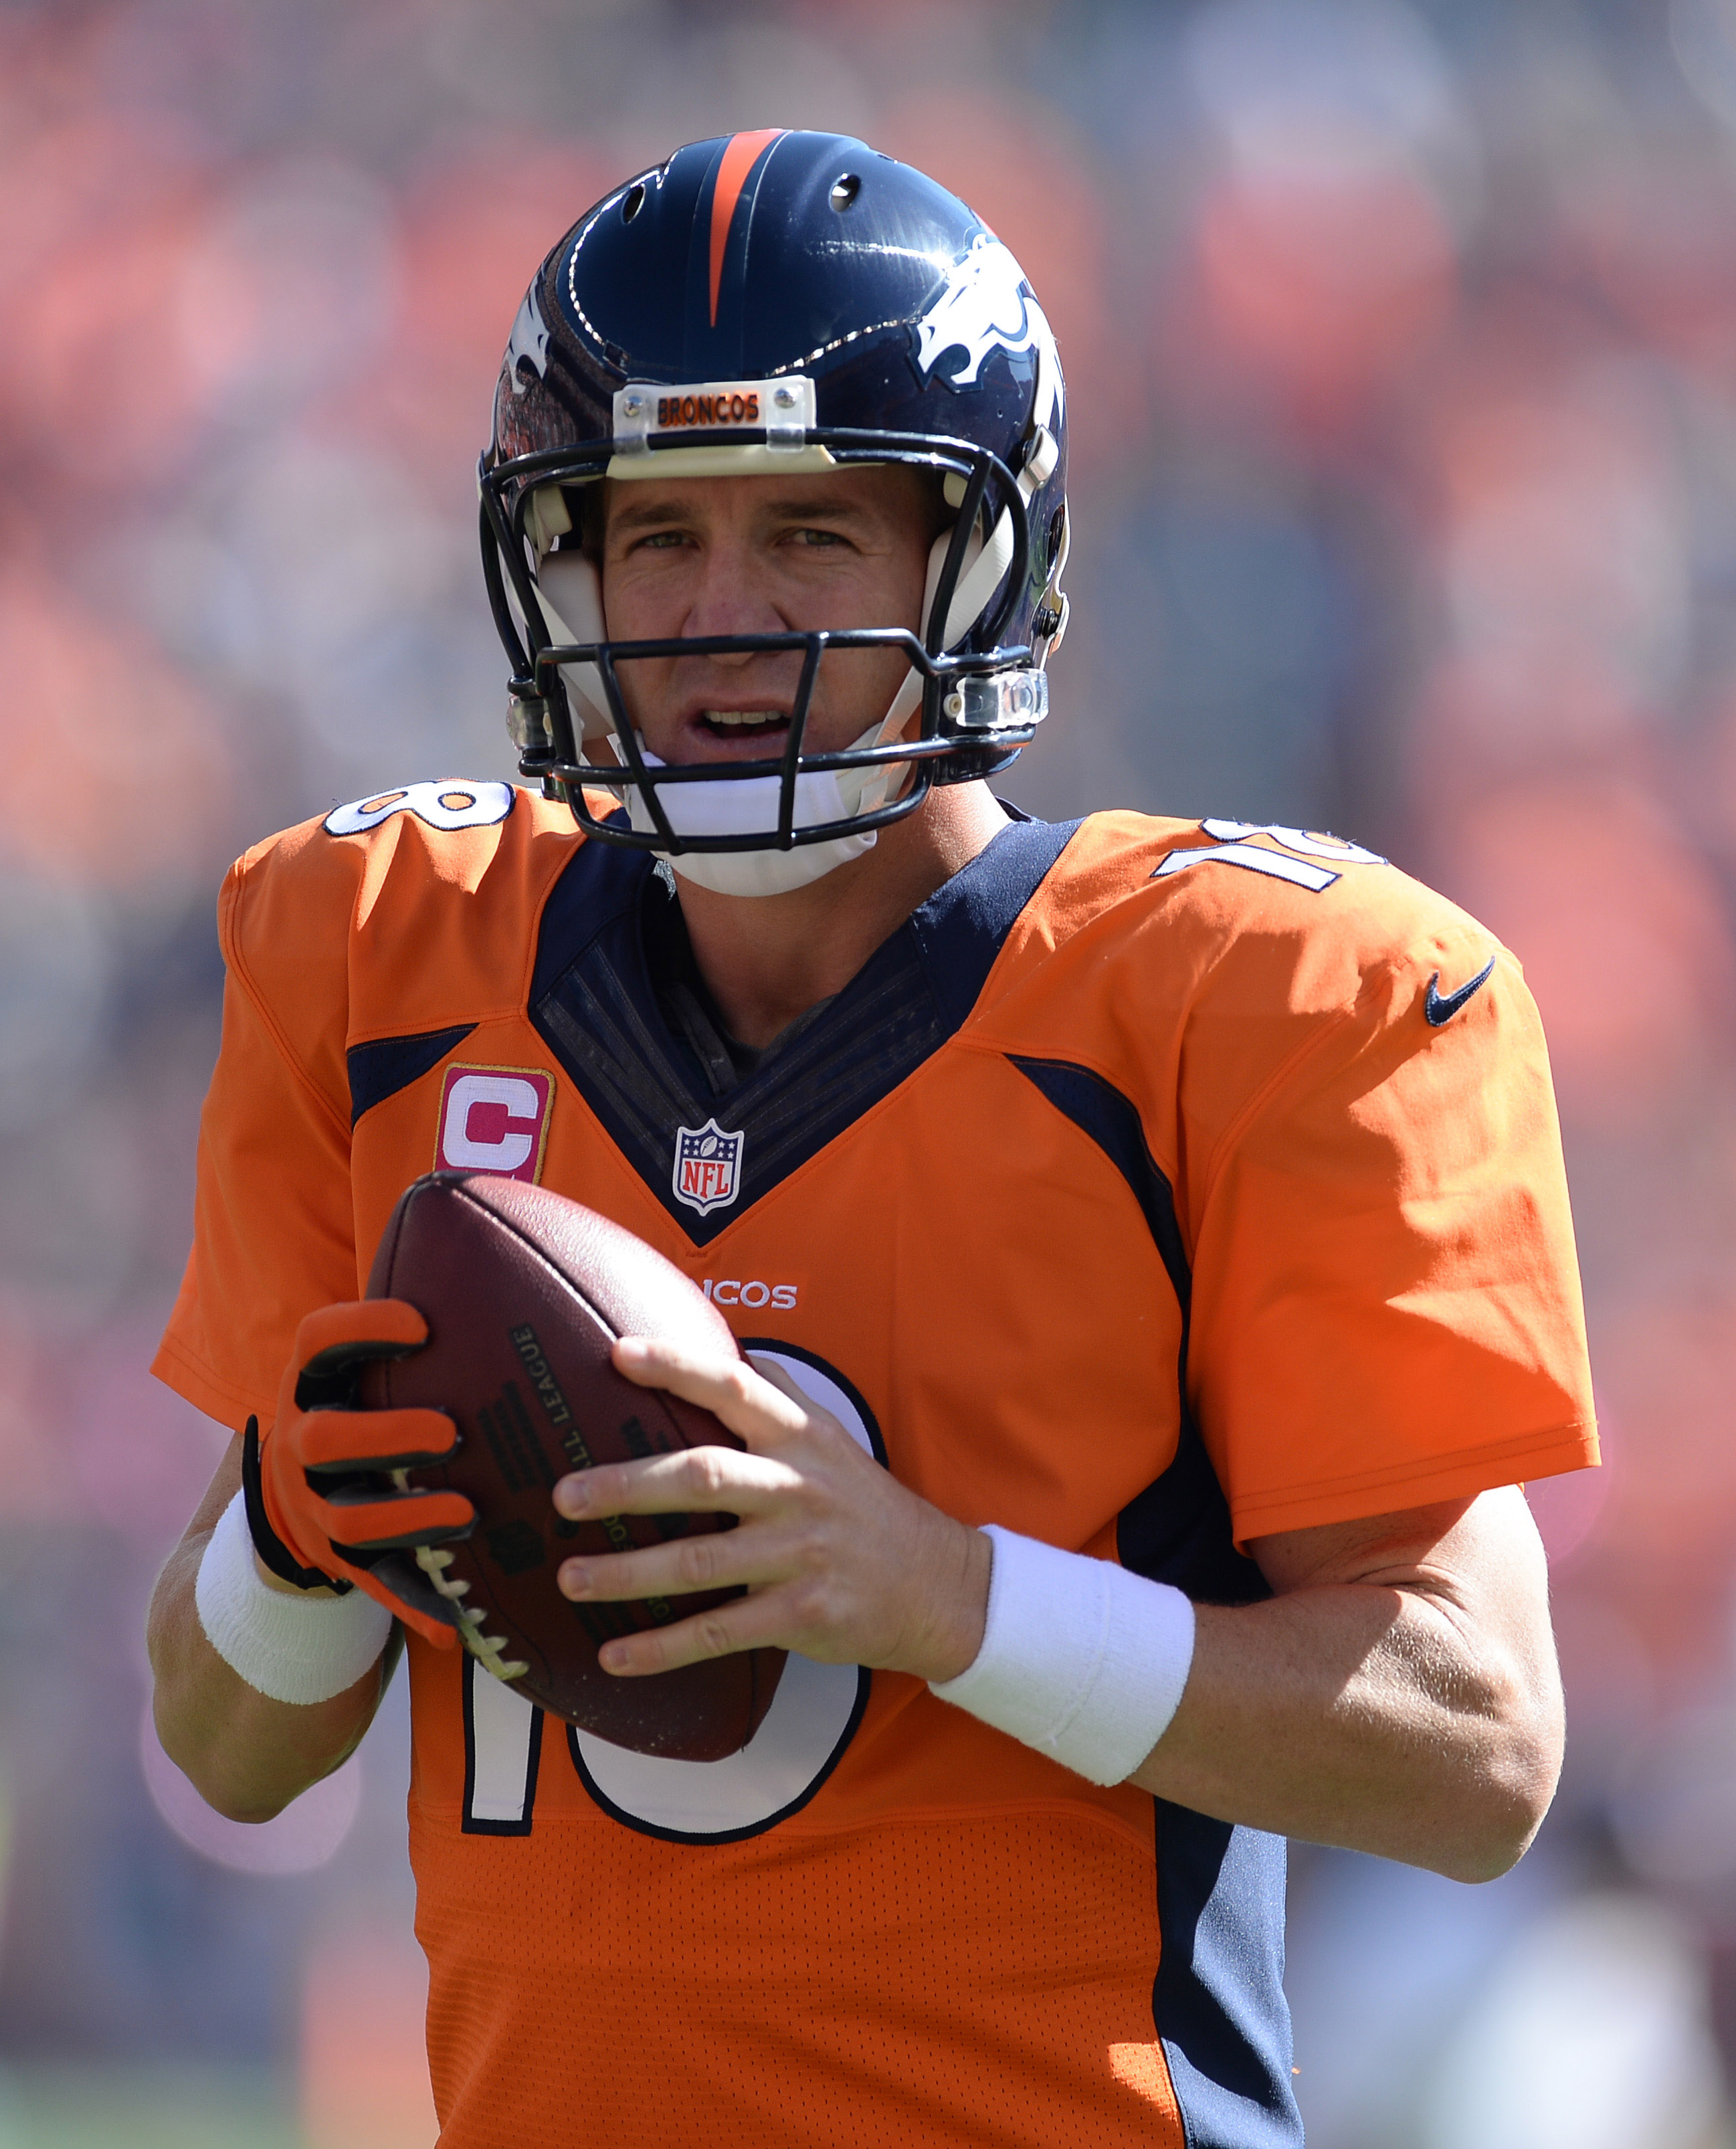
Ron Chenoy-USA TODAY Sports
FINAL RANKINGS AT THE BOTTOM!!!
The NFL has changed. Quarterbacks throw. And throw a lot. There are more games now than in Staubach's and Bradshaw's day. Manning is about to surpass Favre as the all time leader in almost every category. But where does that put them on the all time list.
I chose to analyse the typical all time list (post 1970 merger) and added a couple of the younger guys who will inevitably make the list.
Staubach (retired)
Bradshaw (retired)
Montana (retired)
Marino (retired)
Elway (retired)
Young (retired)
Favre (retired)
Warner (retired)
Manning
Brady
Brees
Rodgers
1st we'll take a look at how the NFL has changed. Then we'll take a new look at comparing QB's but not with sheer numbers. Not based on longevity. My analysis compares each of the all time greats compared to a league average quarterback at that time. How much better are they then their competition?
A Basketball example to why. In 1961-62 Wilt Chamberlain averaged 50ppg and 26rpg. Numbers that have not and will never be seen again. That same year Oscar Robertson averaged 31ppg 11rpg and 11apg. Again never again. ROY that year Walt Bellamy averaged 32ppg and 19rpg. Elgin Baylor averaged 38ppg, 19rpg and 5apg. It was a different era. The NFL is no exception. Era's have changed. The game has changed. The rules have changed. Coaching strategy has changed. Travel and Hoteling have changed. Salaries have changed.
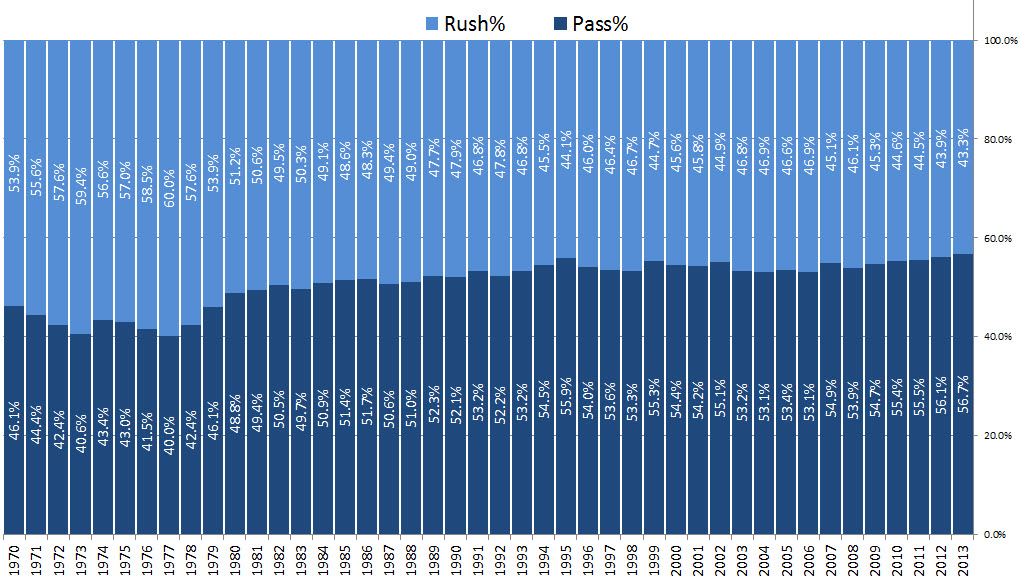
The below graph shows the change of % of Pass plays vs Rush plays per year.
The below graph shows how QB's in general (for whatever reason; rules, film study, technology, youth football programs, etc) are more accurate in today's NFL than in 1970's.
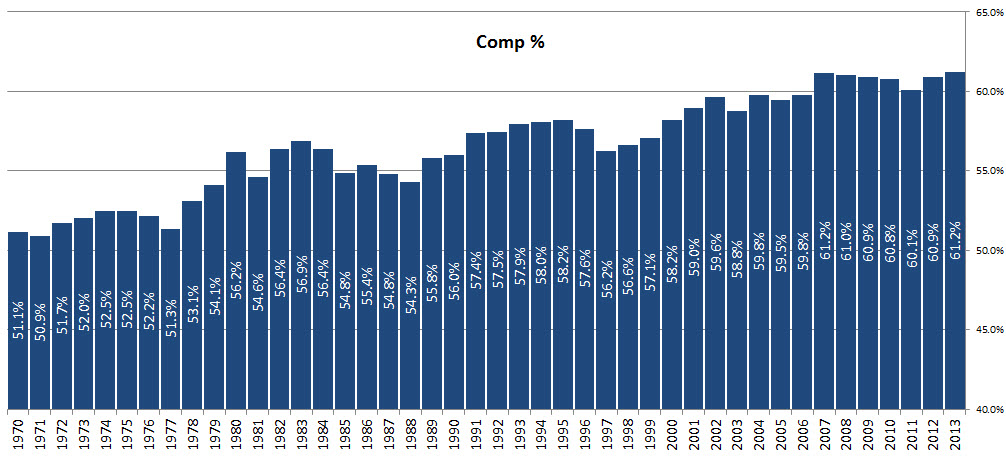
Without looking at the numbers, its safe to assume that Drew Brees throws a lot more than Bradshaw did. Again the NFL has changed. And based on the above, its safe to assume that Manning had a better Completion %age than Staubach. But the NFL has changed.
Below is an example of Manning's completion %age from 2004 vs Staubach's completion %age from 1971
Manning - 67.6%
Staubach - 59.7%
Is Manning 8%age points better than Staubach? How do we account for the change of times? I have compared these all time greats to an average QB from that particular year. That takes into account rule changes, change in times, etc, and figures out how good was the player compared to other QB's in their time. The results may surprise you and in some cases reassure your belief in greatness.
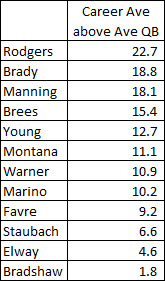
Below is the same example as above comparing how many %age points above an average QB were Manning and Staubach. You can see that when comparing to the times, Staubach was 4+%age points better than Manning when comparing to an average QB of the time.
Manning - 13.1% better than an average QB in 2004
Staubach - 17.4% better than an average QB in 1971
METHODOLOGY
I took 4 QB passing criteria's to analyze these quarterbacks (excluded years they played less than 8 games due to injury or being a backup). At the end I added in analysis on Playoff and Superbowl to come up with my rankings
1. Average Yards Per Game (Y/G) above the league average for each year
2. Average Touchdowns Per Game (TD/G) above the league average for each year
3. Completion Percentage (Comp %) above the league average for each year
4. Touchdowns minus Interceptions (TDs minus INT)
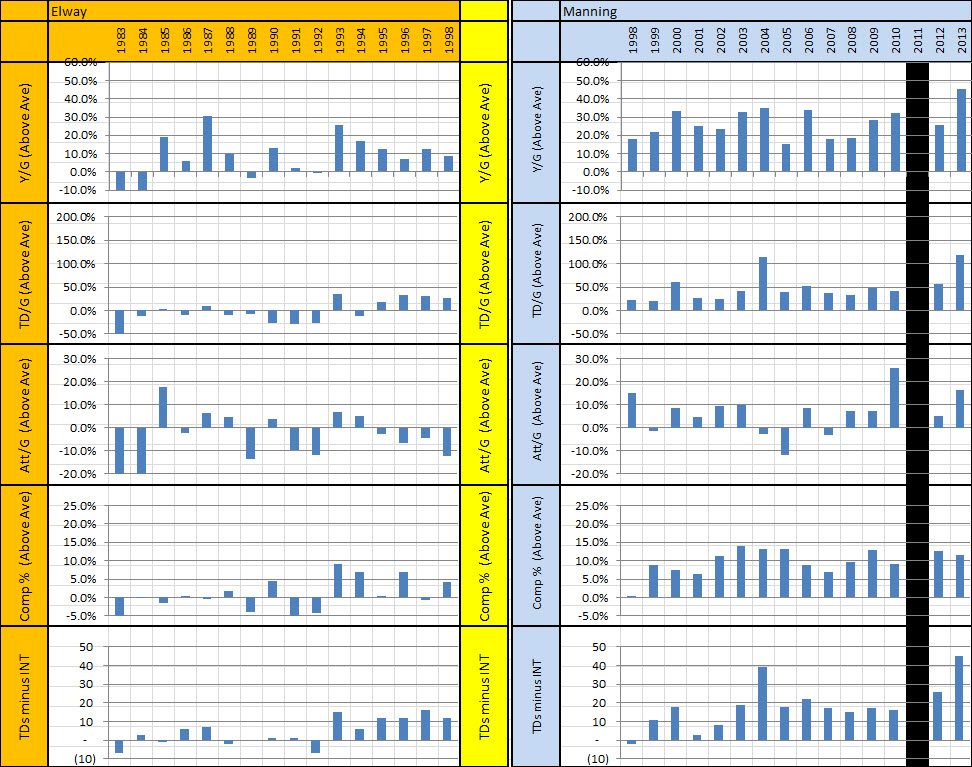
Below is an example showing Manning vs Elway with the above 4 criteria (Both QB's typically appear somewhere on the top 5 list) -
You will see below that while Manning threw above average TD/G and Comp % every year of his career, while Elway only had 7 years where he threw more TD's than an average QB and had a better Completion %age than an average QB.
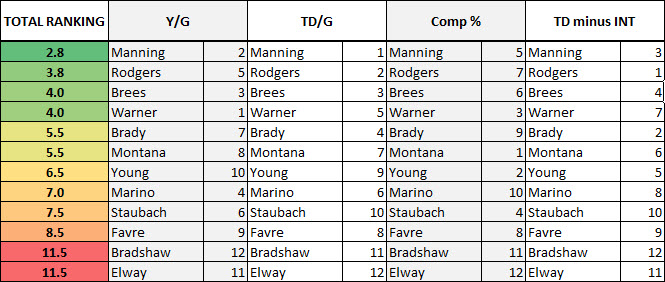
So when doing the above analysis for all the QB's mentioned, here are the results.
1. Average Yards Per Game (Y/G) above the league average for each year
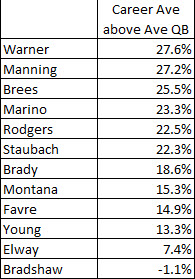
- Manning (15 years) & Rodgers (6 years) are the only QB's to be at least 10%+ better than an average QB every year
- Staubach 75% of his career had an average of 20% higher than an average QB. At 58.3% Brees has the most 30%+ years. At 25% Warner has the most 40%+ years.
- The highest mark for 1 year was Marino at 54.3% higher than an average QB in 1984
2. Average Touchdowns Per Game (TD/G) above the league average for each year
- Elway: 9 of 16 applicable years threw less TD/G than an average QB
- Brady: The highest mark for 1 year was 122.7% higher than an average QB in 2007
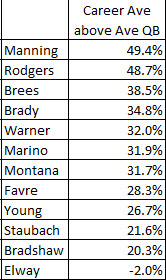
3. Completion Percentage (Comp %) above the league average for each year
- Montana had 3 years in which his completion percentage was 20%age points higher than an average QB. Young had 2, and Staubach 1.
- Elway is the only one to never have at least 1 season of higher than 10%age points above a league average quarterback
4. Touchdowns minus Interceptions (TDs minus INT)
- 2 QB's have had an TD minus INT net score of 40+ (Brady = 42 and Manning = 45)
- 2 QB's have had 4 seasons of a negative TD minus INT net score (Favre and Elway)
- Brady has the longest streak of at least +10 TD minus INT net score (12 years in a row and counting...). Manning and Brees have 10, and Rodgers current streak is 6
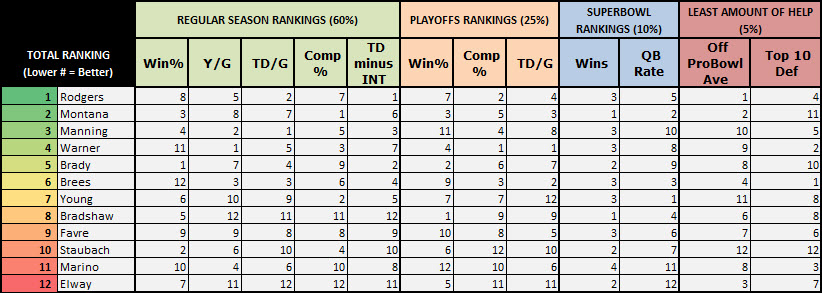
Here is how the stats line up for my new ranking -
DISCLAIMER: I've mentioned this before. NBA players and NFL quarterbacks are the only athletes in team sports that are mostly judged on the championships they have won, and their playoff success, as fair or unfair as that may be. So the analysis continues past the regular season...
1. NOBODY CAN DO IT ALONE. Who has had the most help. For QB statistical data, Offensive Line and Offensive Weapons (a little chicken and the egg here) mean the most. For Win/Loss data, team needs a good Defense too.
Check out the below help rankings based on Pro Bowl selected players and Defensive Rankings.
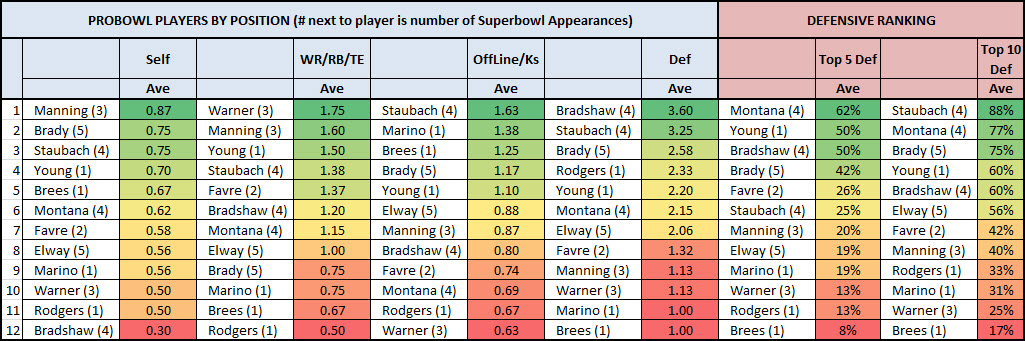
- Warner had the most amount of Offensive Weapon Probowlers (1.75 / year), while Rodgers has the least (0.5 / year). Brees, Marino, Brady are the others that are under 1/year.
- Defensive help. The Steel Curtain and Cowboys defense have Bradshaw (3.6 probowlers/year) and Staubach (3.25 /year) ranked at the top, while Brees, Marino, Warner, Manning, and Favre round out the bottom at under 2/year. That said Montana played 62% of his career with a top 5 scoring def (77% of career with a top 10 def). Staubach (4 Superbowl appearances), Montana (4 Superbowl appearances), Brady (5 Superbowl appearances), Young (1 Superbowl appearances), Bradshaw (4 Superbowl appearances), and Elway (5 Superbowl appearances) all had at least 50% of their careers with a top 10 def. Brees (1 Superbowl appearances), Warner (3 Superbowl appearances), Marino (1 Superbowl appearances), Rodgers (1 Superbowl appearances), Manning (3 Superbowl appearances), and Favre (2 Superbowl appearances) all played less than 50% of their career with a top 10 def. Thats 23 Superbowls for QB's with 50+% of careers with top 10 def vs 9 Superbowls for QB's with less than 50% of careers with a top 10 def.
2. Playoff / Superbowl Performances
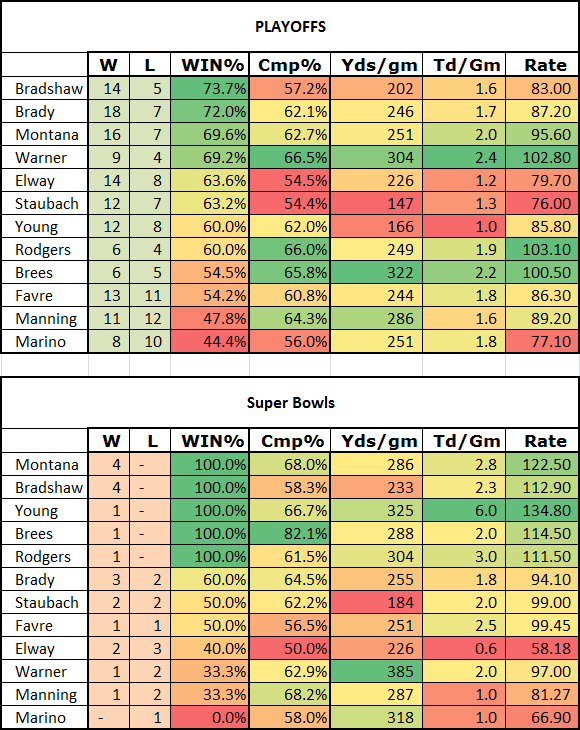
- Montana in 1989 and 1990 won 2 superbowls. In those playoffs he threw 19 tds and 1 int
- Elway: In his 1st 3 Superbowls his teams were outscored 136-40 (average 45-13)
- Young only played in 1 Superbowl, but had 66.7% completion, 325 yards, 6tds / 0 ints) for a QB rating of 134.8. In Brees's only SB appearance he threw an incredible 82.1% completions for 288 yards and 2 touchdowns for a QB rating of 114.5
PUTTING IT ALL TOGETHER.
HERE ARE MY RANKINGS
*** Note: The more years a current player continues to play (example - Rodgers) the more likely they will move down the list as their latter years bring down their averages.