Why Traditional Box Stats Cannot Be Fully Trusted
The easiest method to compare NBA players is by comparing their base statistics. Generally, a player’s blocks per game can tell you if that player is an effective rim protector, and a player’s three-point percentage can tell you how good a player is at shooting from beyond the arc. However, these basic metrics are not always the best ways for showing how good or bad a player is at a particular part of the game. There are many factors that contribute to certain stats that can make a player seem a lot better or worse at a particular facet of the game.
Here are four situations that show the issue with base stats and that players’ stats and production may not exactly show how effective or skilled they actually are:
Situation #1:
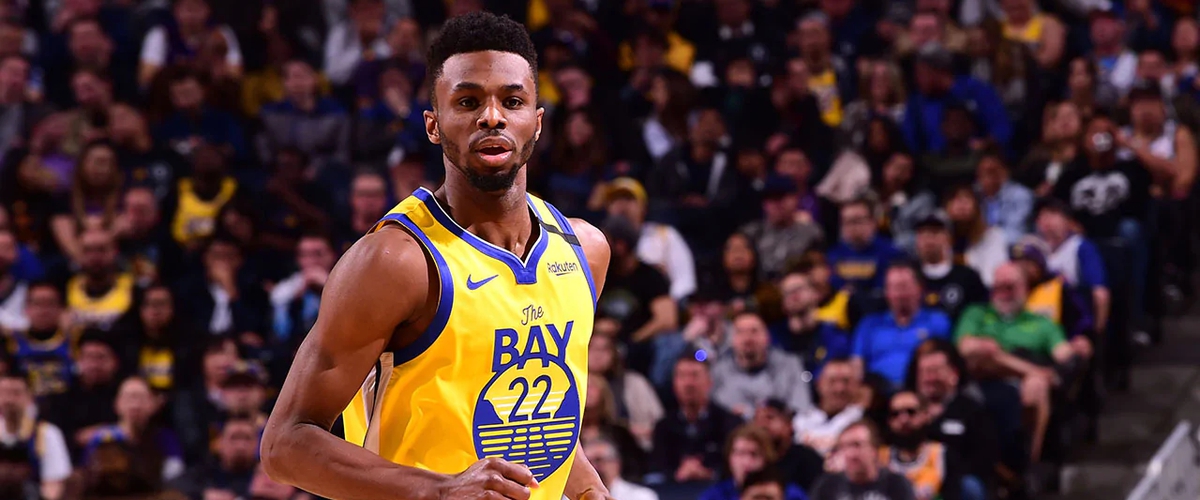
Let’s take a look at Andrew Wiggins. For his career, Wiggins shoots just over 44% from the field and 33% from downtown for his career. With the Timberwolves, Wiggins was expected to be either the main or second scorer on the team with very limited offensive weapons.
Now, though, he plays for the Warriors, and there are two important factors that may help increase his efficiency in the coming season: his shot selection and teammates’ floor spacing ability. His shot selection should improve, as some of the scoring load will come off his shoulders when Steph Curry and Klay Thompson are healthy, and, with these aforementioned players back in the lineup, Wiggins should be able to garner some more open looks.
Let’s say that, due to these factors, Wiggins’ numbers jump up 3 percentage points each (to 47% and 36%) in this coming year. Does this mean that Wiggins is all of a sudden a better or more efficient scorer than players who have lower shooting splits, like Donovan Mitchell (44% FG, 35.5% 3PT)? We need to remember that, in the case of primary scorers, percentage points tend to be lower as they need to generate as many looks as possible and not necessarily the most efficient ones. Those who are secondary players, however, are expected to lean more on the side of efficiency. All we can see with this is that Wiggins may be more efficient, but not necessarily “better”.
That is why, when go-to players (who are the focus of the defense) are scoring with above-average efficiency, it is even more impressive than an average player with those same shooting percentages. From this, we can extrapolate issue number one: While shooting percentages are easy to use to gauge a player’s skill, a player’s teammates and system may make that player’s shooting percentages look a lot better or worse, depending on the situation.
Situation #2:
Bill Russell, one of the greatest shot blockers of all time, is known for his innate ability to block opponents’ shots into the hands of his teammates, helping his team start fast breaks extremely frequently. On the other hand, Dwight Howard, another top shot-blocker in the league’s history, is known for viciously blocking opponents’ shots into the stands. While both of these players get credit for their blocks, there is a fundamental difference between the two: while Russell blocks the ball to his teammates (effectively ending the offense’s chance to score), Howard’s blocks give the ball right back to the offensive team (giving them another opportunity to score). While an argument can be made that Howard’s blocks are intimidating to the offensive team (resulting in them shooting lower percentage shots out of fear of Howard’s shot-blocking ability), there is no way to quantify this type of phenomenon, while we can obviously see that a block that is rebounded by the defending team (stopping the other team’s offensive possession) is more valuable than a block that is swatted out of bounds (and goes right back to the offense). Clearly, not all blocks are created equal, and using blocks per game as the only metric for interior defense is severely flawed.
Furthermore, let’s compare two of the league’s current premier shot blockers, Hassan Whiteside and Rudy Gobert. Whiteside averages 2.4 blocks and 8.4 defensive rebounds in 26.8 minutes per game, and Gobert averages 2.2 blocks and 7.7 defensive rebounds in 29.5 minutes per game. Based on these statistics alone, Whiteside looks like the superior defender, as he blocks more shots per game and grabs more defensive rebounds (important as they end the other team’s offensive possession) per game while playing fewer minutes than Gobert. However, there is a reason why Gobert is a two-time Defensive Player of the Year (and three-time All-Defensive First Team) and Whiteside has made the All-Defensive Second Team just once.
While Whiteside is known to go block hunting (putting himself out of position many times to contest shots efficiently, stop passes, or grab rebounds), fellow NBA players say incredible things about Gobert. Garrett Temple said of Gobert “He changes three times as many shots as he blocks”, and Larry Nance was quoted as saying “It’s not just his blocked shots either; it’s all of the shots that he alters that makes him so good. He just covers so much more area than other centers”. I can go on about why Gobert is a better defender, but it is generally accepted that Gobert is a better defender so there really is no need.
This sums up perfectly what makes the blocks statistic (and other stats as well) imprecise. Blocks do not sum up defensive impact at all, as it does not account for how effective a player is at contesting and challenging shots, how much of a deterrent a player is to offensive players, and if that player is even a serviceable defender at all. All it does is show that the player blocks a few shots a game.
Thus, we are able to fully comprehend issue two: Although players may have similar numbers in a particular stat, this does not mean that those players are comparable in what that stat is intending to show.
Situation #3
In 2010, Aaron Brooks, a third-year player for the Houston Rockets, set career highs in minutes (35.6), points (19.6), rebounds (2.6), assists (5.3), steals (.8), and blocks (.2), culminating in him winning the NBA’s Most Improved Player award. Now, the question is, why is Brooks on this list? Didn’t he improve? Didn’t he deserve the MIP award?
I, for one, am not convinced at all that he improved. For starters, Brooks was given the keys to the offense because Yao Ming’s injury kept him out the whole season and Tracy McGrady played only six games before being traded to the Knicks in February. In other words, the Rockets decided to give their first-round pick from a few years prior more playing time and leeway, as the team’s stars were all out and there was no harm in seeing what the young player could do for their team.
Here is the real problem: although he was given plenty of opportunities with many teams after that season, Brooks never again played over 23 minutes per game or averaged 11.6 points or 3.9 assists in a season after that. In other words, while Brooks’ stats improved that season, that does not mean that he, as a player, improved. That season was the product of a young, unproven player being in a perfect situation: the Rockets wanted to see what they had in Brooks, and with the star players injured, they allowed him to do whatever he wanted. After he was voted MIP, the Rockets (among other teams for years after) realized that he just was not as good as that season made him look, and did not give him nearly as much playing time afterward.
On the other hand, let’s take a look at Andre Iguodala. Before joining the Warriors, Iguodala averaged 15.1 points, 5.8 rebounds, and 4.9 assists in his NBA career. Since joining the Warriors, his stats have taken a massive hit, as he has averaged only 7.9 points, 3.9 rebounds, and 3.4 assists. Based on what we see with Aaron Brooks (and what we have witnessed for the past five NBA Finals), does this necessarily mean that Iguodala has gotten significantly worse in that season when he joined the Warriors? Of course not. In fact, Iguodala had become a more efficient version of himself, upping his eFG% from 50.1% on the 76ers and Nuggets to 58.7% during his Warriors tenure. Iguodala was in the opposite scenario of Brooks. While Brooks was a young, unproven player whose star players were out, Iguodala was a proven veteran who knew he was going to have to sacrifice his ball-dominant style in order for his team to have more success.
We can see from this issue number three: While a player’s sudden improvement or decrease in stats may seem to be due to the player’s increase or decrease in talent level, the context of the player’s situation can help explain why there was the statistical jump or reduction.
Situation #4
When NBA fans look at the stats from the earlier times of the NBA, they often wonder how it was possible that players could consistently average over 30 points per game, 20 rebounds, and other incomprehensible numbers. People look at players such as Wilt Chamberlain, Bill Russell, Elgin Baylor, and others and wonder how they put up the numbers they did. The answer is quite simple: these numbers are unbelievable to us because we are looking at them through the 2020 statistical lens (in which these stats are literally unattainable). Let me explain what I mean further:
In 1962, the NBA’s average possessions per game was around 126, but, In 2019, the number of possessions per game was exactly 100. This means that, if a player in 1962 and 2019 both played the same amount of minutes, the player in 1962 would have 26% more chances to compile stats. If a player played 36 minutes per game in these seasons (among the top numbers for players in 2019), the player in 1962 would play in 94.5 possessions (almost the amount of possessions in a full 2019 game), while a player in 2019 would play only 75 possessions. See the issue? If I played 36 minutes per game and shot on 25% of my team’s possessions, in 1962 I would average 23.63 shots per game, and in 2019 I would average only 18.75 shots per game. That is almost 5 more shot attempts per game!
As NBA teams have gotten more cautious towards resting their star players, the minutes per game numbers for stars has dropped off. In 2019, the NBA’s league leader in minutes per game played 36.9 minutes per game, while in 1962 the NBA had 12 players play at least 37 minutes per game (7 players played over 41 minutes per game). Clearly, more time spent on the court means more chances to pile up statistics, such that stars of that era (particularly Wilt Chamberlain, who that season averaged 48.5 minutes per game) were able to average such high numbers.
In 1962, the league’s average field goal percentage was 42.6%, while in 2019 the average field goal percentage was 46%. With teams nowadays having fewer possessions (which equates to fewer shot attempts) and shooting more efficiently, we can clearly see that the rebounding opportunities presented in 1962 were significantly greater than they are today. Therefore, we should not be surprised to see the best rebounding players in the late 1950’s and 1960’s average rebounding numbers that seem eye-popping today. In an average game, teams in 2019 averaged 45.2 rebounds per game. In 1962, that number was 71.4, over 26 more rebounds per team per game. A crazy stat came from this: In 1962, there were eight teams in the NBA, and there were 17 players in the league who averaged 9 or more rebounds (over two per team, on average). In 2019, when there were 30 teams in the NBA, there were 18 players who averaged 9 or more rebounds (fewer than two-thirds of teams).
Now, if a big man from today (such as Andre Drummond) played in 1962 (with 26% more possessions, lower field goal percentages, and more minutes), what could his stats have looked like? For his career, Drummond has averaged (in 31 minutes per game): 14.5 points, 13.8 rebounds, and 1.3 assists on 54.2% shooting. With all of these added bonuses of playing in 1962, is it really inconceivable to think that Drummond could have averaged 25 points and 25 rebounds? If Drummond’s minutes increased by 10, he played an extra 26% possessions and had more rebounding opportunities, I think this would be easily within reach for Drummond, and maybe even a surprise if we didn’t.
Here we can fully understand issue four: Although every player has base stats such as points, rebounds, and assists, due to style, rule, and play changes, the same stat may hold different values at different times, and therefore should not be weighed equally across eras.